From baby boomers to millennials: Sex Now survey reveals shift in Liberal and NDP voting among Canadian queer men
While the primary focus of the Sex Now survey is to examine Canadian queer male sexual health, one aspect of the 2014-15 survey was political participation.
What was new for the 2014-15 survey was that the Vancouver-based Community Based Research Centre (which conducts the periodic survey) analyzed results according to generations of LGBT people, to take a closer look at how social, economic, cultural, and political factors affected different age groups of men.
The survey divided men into the following groups:
Generational Gay Legal: born from 1944 to 1955, aged over 60, baby boomers, came of age in the late 1960s and 1970s. As the U.S. Stonewall riot took place in 1969, Prime Minister Pierre Trudeau's Liberal government decriminalized homosexuality in Canada with the Criminal Law Amendment Act of 1968-69.
Generation Gay Pride: born from 1956 to 1970, men aged 45 to 59, from late boomers to Generation X, came of age from the mid-1970s to the late 1980s. This generation witnessed the Toronto bathhouse raids in 1981, sparking the creation of Toronto Pride and political activism.
Generation Safe Sex: born from 1971 to 1980, men aged 35 to 44, Generations X and Y. The HIV/AIDS crisis and the safe sex revolution arose as this generation was coming out.
Generation ART: born from 1981 to 1990, men aged 25 to 34, Generation Y to millennials. The first successful HIV treatments, known as antiretroviral therapy (ART), were launched.
Generation Gay Marriage: born from 1991 to 2000, aged 15 to 24, millennials. This generation saw same-sex marriage legalized in Canada by Prime Minister Paul Martin's Liberal government in 2005.
CBRC research director Terry Trussler said by phone that the political participation questions particularly interested him because "it indicates the thinking of a particular group about how they vote" and the "overall cultural leanings of gay men"
Prior to the 2015 federal election, survey respondents were asked how they would vote. Liberals were named by 41 percent of the eligible respondent voters while NDP were chosen by 25 percent, and Conservatives by 13 percent.
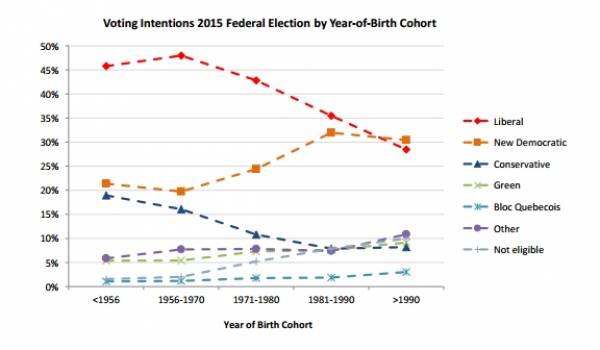
However, when broken down by generational groups, the Liberal vote significantly decreased as age decreased.
The Liberal vote peaked amongst the second oldest group (aged 45 to 49) at 48 percent, followed by the eldest group (60 years and over) at 46 percent. Numbers declined as ages grew younger, shrinking down to 28 percent for those 25 years and younger.
In contrast, the reverse was true for the NDP, with 21 percent among those 60 years and over and increasing to 30 percent of those 25 years or younger.
While there was a large voting gap between Liberals and the NDP among the eldest group (with 46 percent for Liberal and 21 percent for NDP), among the youngest group, the NDP led slightly ahead of the Liberals but were very close (with 30 and 28 percent respectively).
Conservatives scored low overall amongst all age groups, decreasing from 19 percent among the eldest generation to only eight percent among millennials.
There was a slight increase among Green Party votes as ages grew younger, from five percent among the oldest generation to nine percent for millennials.
 Sex Now 2015
 Political participation greatly increased with age overall.
For the eldest generation, 81 percent voted in the last municipal election, 89 percent voted in the last provincial election, and 91 percent voted in the last federal election. Only five percent did not vote in recent elections.
In comparison, the lowest participation numbers came from the millennials, with 39 percent for the last municipal election, 44 percent for the last provincial election, and 38 percent for the last federal election. Out of all the age groups, the youngest group had the highest number of non-voters in recent elections at 33 percent. In comparison, other age groups ranged from 10 to 18 percent who did not vote. The youngest group had 13 percent who were not eligible to vote while the eldest two groups had two pecent each who could not vote.
Trussler said that the implications of these political leanings are important for the idea of structural stigma, which is something that is being increasingly discussed in health research. Structural stigma refers to social conditions, norms, or practices that restrict the wellbeing of, opportunities for, and resources for stigmatized populations.
"Under strict and restricted kinds of policy, gay men would not do well but under more liberal policies…it's a lot better for health in terms of…minority stress," he explained.
For more on the Sex Now 2014-15 survey results, see this article. The full report of the Sex Now survey can be found at the CBRC website.


Comments